Website Observability: Detect Problems Before Customers Complain
A website can appear online while inquiry, checkout, or booking flows are quietly failing. Learn how to monitor uptime, errors, performance, and critical business journeys as one connected system.
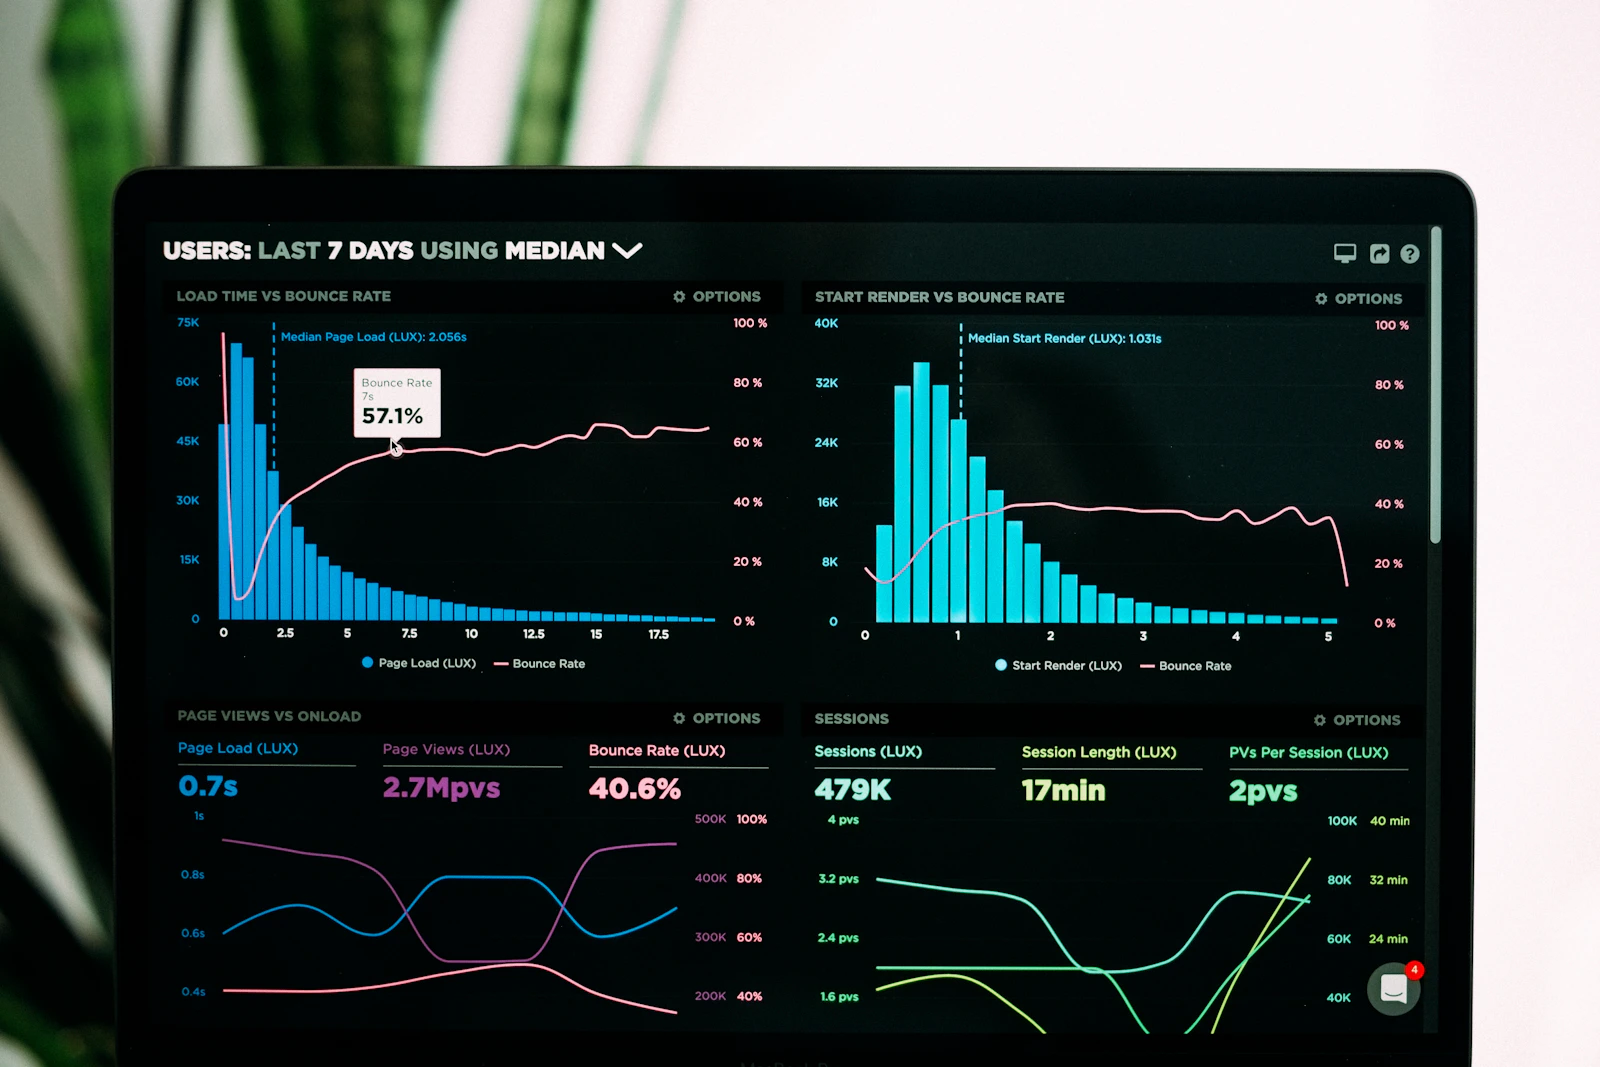
A business website is not truly healthy simply because its homepage still opens. A form may stop delivering data, a WhatsApp button may point to an old number, checkout may fail at payment, or a campaign page may become painfully slow on specific devices. These problems are often discovered only after a customer complains—or after opportunities disappear without leaving an obvious trace.
Website observability is an approach to understanding website health through connected signals. It goes beyond asking whether a server is alive and examines whether user experiences and business processes are actually working as intended.
Monitoring Versus Observability
Monitoring usually answers known questions: Is the site down? Has response time crossed a threshold? Is infrastructure usage unusually high?
Observability helps investigate questions that were not fully predicted. When conversion suddenly drops, a team can trace whether the cause is a JavaScript error, a slow API, a mobile layout change, a broken CRM integration, or lower-quality traffic.
Monitoring raises an alarm
Monitoring works well for clear limits such as uptime, error spikes, and page-speed thresholds.
Observability provides context
Observability connects technical data, user behavior, and business outcomes so teams can understand why an issue happened and who was affected.
Four Layers to Observe
1. Availability and uptime
Uptime checks remain essential, but do not monitor only the homepage. Check revenue and service-critical pages such as campaign landing pages, product pages, inquiry forms, member login, checkout, and confirmation pages.
- HTTP status and response time
- SSL certificate and domain expiry
- DNS availability
- Responses from different regions or networks
2. Real user experience
Real-user data shows what visitors experience across devices, browsers, and connection quality. Averages often hide problems affecting specific segments, such as mid-range Android users or unstable mobile networks.
- Time until primary content becomes visible
- Responsiveness after a tap or click
- Layout movement during loading
- Performance by device, page, and traffic source
3. Application and integration errors
Modern websites depend on forms, payment gateways, shipping APIs, email, WhatsApp, CRM, analytics, and third-party services. A single integration failure can break a journey that looks normal from the outside.
Record errors with useful context: page, timestamp, device type, user step, called service, and response status. Sensitive personal information should never be exposed in logs.
4. Business outcomes
The most important layer is confirming that business processes finish successfully. A site can attract strong traffic while producing little value.
- Forms are submitted and stored in CRM
- Leads receive confirmation
- Orders are recorded after payment
- Bookings reach the calendar
- Analytics events are recorded without duplication
Observe Journeys, Not Just Pages
Many teams monitor each service separately. The server looks healthy, the payment provider is online, and CRM is accessible. Yet customers still cannot complete a transaction because the connection between systems has failed.
Create synthetic journeys that regularly run critical scenarios:
- Open the landing page.
- Complete a test form.
- Submit the form.
- Confirm that the success page appears.
- Confirm that the test lead reaches CRM.
- Confirm that notifications are delivered.
Business-process alerts are usually more meaningful than isolated CPU or server alerts.
Define Practical Service Levels
Not every page needs the same level of supervision. A portfolio homepage and an e-commerce checkout carry different business risks. Group systems according to impact.
Critical journeys
Checkout, booking, customer login, and sales forms need tight targets and fast notifications.
Important journeys
Service pages, search, and catalogs should be monitored, while incident response may align with operating hours.
Supporting content
Articles and informational pages matter, but a brief disruption rarely needs the same escalation.
Targets must remain realistic. Too many alarms create alert fatigue and eventually get ignored.
A Dashboard Business Teams Can Use
The best dashboard is not the one with the most charts. It answers practical questions:
- Are our critical journeys working today?
- How many users are affected?
- When did the issue begin?
- Is it connected to a recent release?
- How many leads or transactions may be at risk?
- Who owns the next action?
Place technical and business indicators together. For example, show rising form errors alongside declining lead volume. That connection improves diagnosis and prioritization.
A Phased Implementation Plan
- Map critical journeys. Select three to five processes closest to revenue or customer service.
- Define success events. Record outcomes such as a stored lead or confirmed payment, not just clicks.
- Add error tracking. Capture frontend, backend, and integration errors with safe context.
- Create synthetic tests. Automatically run important end-to-end scenarios.
- Build an escalation path. Define who receives alerts, when action is required, and how incidents are documented.
- Review monthly. Evaluate false alarms, recurring failures, and new journeys that should be covered.
FAQ
Does a small business need observability?
Yes, but it can start small. Monitor uptime, form delivery, key-page performance, and whether inquiries reach their destination. Focus on the biggest business risks first.
Is analytics enough?
Analytics explains aggregate behavior but may not reveal technical errors or integration failures. Observability complements analytics with system-health and end-to-end journey data.
How many alerts should we create?
There is no universal number. Every alert should be actionable, have an owner, and represent meaningful impact. Alerts that never lead to action should be improved or removed.
Can logs contain customer data?
Store only the minimum required. Avoid passwords, tokens, payment details, and sensitive information. Use masking, access controls, and retention policies.
Conclusion
Website observability turns maintenance from reactive to proactive. By connecting journey monitoring, errors, real-user experience, and business outcomes, teams can discover problems sooner and protect sales opportunities before customers need to report them.
Wirasena Digital helps businesses design websites, integrations, analytics, and monitoring systems around real operating journeys. Let us map the digital processes that matter most so your website does more than stay online—it keeps working.